Debugging into Unity's Internals
You've been tracking a bug in your Unity project for the last few days now, and you're at a loss. All your leads are dry, ending at mysterious Unity Engine calls.

But you're desperate, or perhaps maybe you're just the curious sort. Either way, your questions would be answered if you could just tell what the heck was going on inside that Unity function. You're wondering how to get Visual Studio to let you debug code within Unity's core libraries themselves.
That's precisely what we're going to do.
This isn't for the faint of heart — we'll be decompiling, recompiling, and patching Unity assemblies. However, after you've done it once, it's not quite as tricky as it sounds. With this under our belts it can make debugging complex Unity systems (like UnityEngine.UI) a breeze.
When we're done, we'll be able to step through code inside of the Unity Engine, set breakpoints, and even inspect local and static variables of the editor itself! As always, if you have questions or comments, drop me a line on twitter and I'll do my best to help out.
Stepping through the state transition on a UnityEngine.UI.Button object.
A few notes before we begin. This only allows us to debug parts of Unity that were written in C# (Managed assemblies). We won't be able to debug into Unity's C++ implementation any time soon. This is a fairly important caveat. While quite a few of Unity's systems are written in C# (the UI system, most of the Editor), high-performance systems like the renderer and physics engine are in C++ and off limits for this method.
Remember that any reverse-engineering of software can quickly enter a legal gray area. Be responsible with how you use this information.
Foreword
Readers looking for a quick tutorial can skip this section and the next, however it really is necessary reading if you're looking for a better understanding of Unity.
First things first, let's clarify a few things. Unity doesn't use Microsoft's implementation of .NET, it uses Mono. Mono is an open-source, cross-platform implementation of .NET. Mono lets Unity run on Mac and Linux, and is also the reason why standard assembly debugging tools you may have found before don't work on Unity.
When C# is compiled a .dll file is produced containing IL, an Intermediate Language that is only understood by the .NET 2.0 Runtime. When you want to run this compiled code, the Mono Runtime (which understands .Net 2.0 IL) reads the IL and executes the code. I'm glossing over the bulk of this here, but this explanation should suffice. ILSpy is a great tool for exploring what the IL looks like for a .NET assembly.

Using ILSpy to toggle between the C# code and compiled IL code.
However, note that the .NET Runtime is distinct from the .NET Framework. The .NET Framework provides the libraries and tools that you'd use in your actual C# code. The .NET Runtime is the program actually executing your code.
The runtime Unity uses is .NET 2.0. The framework version that Unity uses is a bit opaque. Again, it's not using Microsoft's .NET Framework, but a Mono-provided one. The Mono .NET Framework mirrors the .NET 3.5 Framework (4.6 is in beta), and is compiled for the .NET 2.0 Runtime as we talked about above. See here for information regarding different levels of .NET provided by Microsoft. Mono attempts to re-implement .NET as closely as possible.

The fairly confusing .NET Framework/Runtime configuration panel in Unity.
You can see evidence of this in Unity's configuration panel, although Unity uses the word Runtime confusingly here. This can be read as "What libraries should my scripting have access to?" "What general backend to use?", and "What IL/Runtime version should we compile against?".
One final note here. The .NET 2.0 Runtime is from 2008. Unity uses it over the modern .NET 4.0 Runtime for a variety of reasons not worth getting into here. This is the main reason the vast majority of C# and .NET libraries will not work with Unity. Most .NET developers have moved long past 2.0.
As you can tell keeping runtime/framework numbers straight in your head can be a bit daunting. I like to think of IL as a distinct programming language, and Unity uses the 2.0 version of that language. Feel free to bookmark this post or the links here if you ever need a refresher. You can also use ILSpy to find out what Runtime version an assembly uses.
The Mono Debugger
You might not know this, but whenever you debug your Unity game in the editor, you're actually debugging the Unity Editor itself. The Unity Editor and your game are run as a single application. When your game hard crashes (segfaults, etc), so does the Unity Editor, and vice-versa.
Debugging managed code is a bit more flexible than debugging something like C++. Thanks to Mono's debugger being a Soft Debugger, we can attach the debugger whenever we want to the running Unity process, without having to restart the application.

The Mono Soft Debugger architecture. The debugger is run within the child application.
This architecture is great for Unity because we can attach and detach the debugger to the process at will. Imagine how painful it would be to have to restart Unity in order to attach a debugger. The downside is that Visual Studio has very little control over the application under debug: it can only send and receive information through the Soft Debugger Interface and try to display something that makes sense.
This architecture is why the Visual Studio debugger for Unity is a little awkward and flaky. All of the debugging is actually happening within Unity/Mono — Visual Studio just provides the UI.
The Beginning
Presumably you have a target DLL in mind. For this tutorial I'll be debugging into UnityEngine.UI.dll. This dll contains all of the code for the 2D Canvas and UI system. The assembly is found on my system at:
C:Program FilesUnityEditorDataUnityExtensionsUnityGUISystemUnityEngine.UI.dll
We would like to do the following:
We need to decompile the target DLL so we have C# code to look at when we're debugging.
Unity DLLs don't come with Debug symbols, so we'll need to generate a PDB for our target DLL, and point it at the source code from step 1.
Unity runs on Mono, not the Microsoft Runtime, so we need to convert the PDB file to Mono's MDB format.
After the above, we'll be able to set a breakpoint in Visual Studio and step through the Unity UI code!
Required Tools:
Visual Studio 2015 or 2017. Community or Professional.
Either RedGate .Net Reflector for Visual Studio or JetBrains Resharper.
I'd personally recommend .NET Reflector for this tutorial because its decompiler is a tad easier to use. After this tutorial, you'll be able to use either for further debugging.
Making the dll debuggable
If we went ahead with the three steps outlined above, we'd run into problems at #2. Only assemblies that contain a Debug Directory entry in the header can be referenced from a PDB symbols file. The debug directory provides identifiers that let the debugger know which symbol files point to which assemblies. Unity doesn't include a Debug Directory in any of its assemblies, so we'll have to do some gymnastics to add one.
Our strategy sounds drastic, but works surprisingly well. We decompile UnityEngine.UI.dll to IL, then recompile it back to an assembly using the '/debug' flag.
We can do this with the following commands. Remember to make a backup!
C:> ildasm NoDebugInfo.dll /out=UnityEngine.UI.il C:> ilasm /dll /debug /Out:UnityEngine.UI.dll UnityEngine.UI.il
ildasm generates a file containing the IL for the assembly. ilasm then recompiles the IL, but this time with the /debug flag so a debug directory is created.
Important Note: You must use the ildasm from the .NET 2.0 Runtime. Look for .Net 3.5 in the command's help output:

Remember that the .Net 3.5 Framework is using Runtime .NET 2.0. Link .
Overwrite the original UnityEngine.UI.dll so that Unity loads the patched assembly instead of the original.
You can verify this worked properly by using the dumpbin /headers UnityEngine.UI.dll command, which for me prints:
... output hidden ... SECTION HEADER #1 .text name 3D1E4 virtual size 2000 virtual address (00402000 to 0043F1E3) 3D200 size of raw data 200 file pointer to raw data (00000200 to 0003D3FF) 0 file pointer to relocation table 0 file pointer to line numbers 0 number of relocations 0 number of line numbers 60000020 flags Code Execute Read Debug Directories Time Type Size RVA Pointer -------- ------- -------- -------- -------- 5A07757C cv 2B 0001F5C8 1D7C8 Format: RSDS, , 1, UnityEngine.UI.pdb ... output hidden ...
Neat! We can see the added debug directory right there.
The command also generates a PDB file, however this PDB points to the decompiled IL file. If we tried to debug using it, Visual Studio would show us the IL, which isn't that useful (to most of us). You can just delete this file (or rename it if you're playing it safe).
Generating the source code
Now that the DLL has a debug directory, we can use more standard tools to generate C# source code for viewing. I used RedGate's .NET Reflector plugin for Visual Studio, although you should be able to accomplish something similar using Resharper and DotPeek.
You'll want to refresh the Visual Studio .sln files at this point to make sure it picks up the new DLL created above. Close Unity, and delete all of the .sln/.cs files in your project directory, as well as the Library folder.
Then re-open Unity, and double click a script to get it to re-generate the solution.
From here, we use Redgate to generate a PDB for the assembly, and in the process it decompiles the assembly to C# source code, storing everything in the Redgate cache folder:
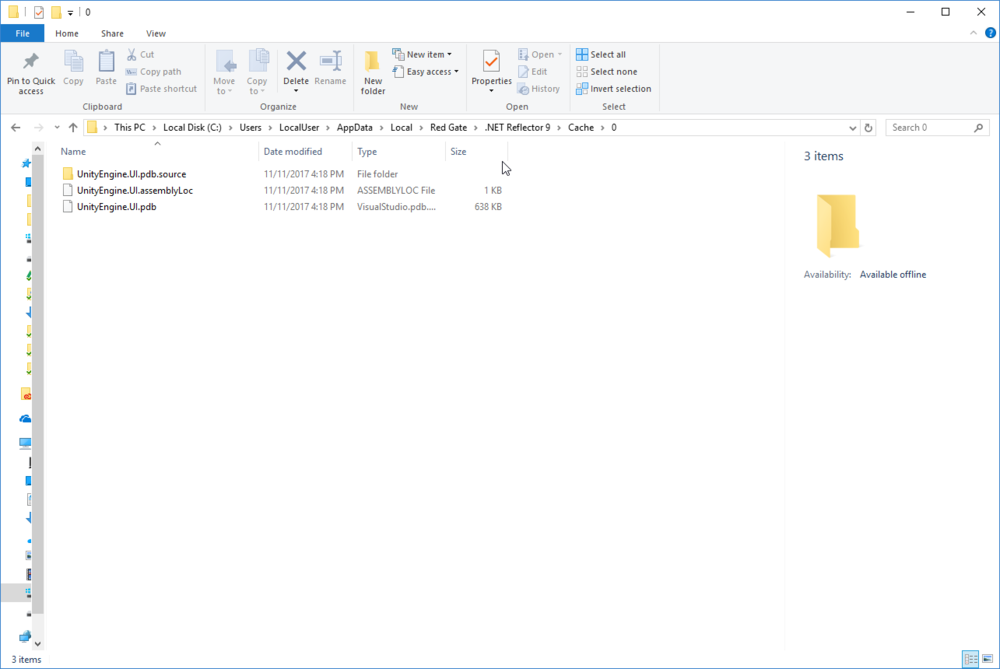
The PDB file and source code generated from our patched UnityEngine.UI.dll assembly.
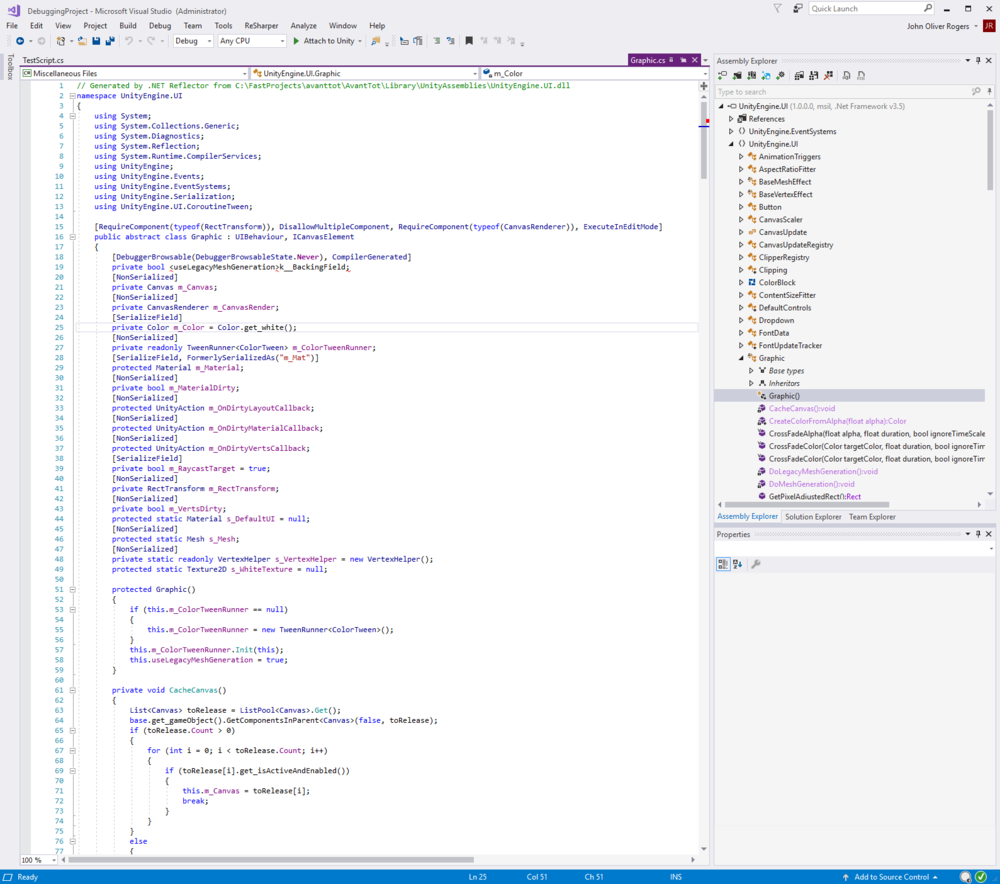
Sample decompiled source from .NET Reflector.
Converting to the mono format
If we weren't running on Mono, we'd be done here. The Mono debugger is soft, as mentioned earlier, so the actual logic to run the debugging happens within Mono itself (within the Unity application), not in Visual Studio. Visual Studio simply talks to the Mono Debugger over a channel and displays what it gets back.
Because of this, our symbol files need to be in a format that the Mono debugger can understand. This format is the MDB format. As a stroke of luck, Unity provides a tool just for this purpose! It's called pdb2mbd.bat:
&"C:Program FilesUnityEditorDataMonoBleedingEdgebincli.bat" "C:Program FilesUnityEditorDataMonoBleedingEdgelibmono4.5pdb2mdb.exe" UnityEngine.UI.dll
This must be run from the location of UnityEngine.UI.dll.
If all goes well, this will write a file: UnityEngine.UI.dll.mdb to the same directory. Unity/Mono will load this mdb file when the Editor loads.
Finishing up
We're done! It's good to clear the Library folder and .sln files again just for good measure.
When you restart Unity, it should have loaded the MDB file for your patched library. With this, we can now set a breakpoint in Visual Studio, again using either Resharper or RedGate (whichever you used for the earlier steps).
Visual Studio will complain about not being able to find the source, but this is actually just due to a weird interaction with the Mono debugger. When the line is actually hit, the breakpoint will load properly and the code will show up!
Here's an example of debugging UnityEngine.UI.Button::Press():
If you've gotten this far, nice work! It was a bit of a struggle! Once you've patch the DLL, you don't need any further setup. You will need to update this whenever a new version of Unity installs, unfortunately, but that comes with the territory.
Hopefully this has been helpful or at least an interesting read! Feel free to drop me a line on twitter questions or comments!